Wall Street, December 2022. Portfolio managers stare quietly at their screens, counting losses. U.S. government debt — traditionally the safest part of a portfolio — has just experienced the worst year in modern history. The Bloomberg U.S. Treasury Index finished around –12.5%, while 10-year yields surged sharply throughout the year.
And gold? It wasn’t spectacular — but it acted as a shock absorber in a year when both stocks and bonds fell simultaneously.
In this article we compare gold and 10-year U.S. Treasury bonds from 1971 (the end of dollar convertibility into gold) to 2026. But beyond numbers, we also examine the real economic stories behind them — how inflation, interest rates and geopolitical shocks shaped outcomes for savers, companies and governments.
In recent years we are again observing something interesting:
the logic of saving is converging — part of “cash” sits in bonds, and part sits in gold.
Why 1971 Matters
In August 1971, U.S. President Richard Nixon closed the “gold window”, ending the convertibility of dollars into gold.
- This event effectively ended the Bretton Woods system and marked the beginning of the modern fiat-currency era, where:
- gold prices float freely in global markets
- interest rates are determined by market forces
- From this point onward we can directly compare the market behavior of gold prices and Treasury bond yields.
Five Interest-Rate Regimes — And How Gold and Bonds Behaved
Regime A: 1971–1980 — Inflation and Gold as an Escape From the System
The 1970s were dominated by high inflation and oil shocks (1973 and 1979).
- During this period:
- 10-year yields rose steadily
- real bond yields were often negative
- gold experienced one of the greatest bull markets in history
- In January 1980, gold reached roughly $850 per ounce.
The economic logic was simple:
when real interest rates fall, the opportunity cost of holding gold declines.


Do not buy a single gram of gold or silver until you have read this gold valuable information.
- Did you know that you can pay up to 59% more than the market price of gold?
- How can you significantly reduce the price of gold and silver?
- You can get up to + 1/3 more precious metals for your savings!
- Physical investment gold and silver of the highest quality. Good delivery.
BONUS! Extremely tax efficient: you pay absolutely no tax!
Enter your name and email address now to participate for free.

Regime B: 1981–2000 — Volcker, Disinflation and the Great Bond Bull Market
In the early 1980s 10-year Treasury yields reached double-digit levels, peaking near 15%.
What followed was a 40-year structural decline in interest rates.
- This period became one of the greatest bond markets ever:
- high coupons generated strong income
- falling yields produced large capital gains
Gold, in contrast, stagnated for long stretches, while bonds became a reliable long-term savings machine.
Regime C: 2001–2011 — Dot-Com Crash, 9/11 and the Global Financial Crisis
After the dot-com collapse and the 2008 financial crisis, central banks responded with:
- aggressive interest-rate cuts
- quantitative easing (QE)
During this era gold became a global hedge against systemic financial risk.
By 2011, gold had surpassed its previous nominal record from 1980.
In this decade gold clearly outperformed 10-year Treasuries.
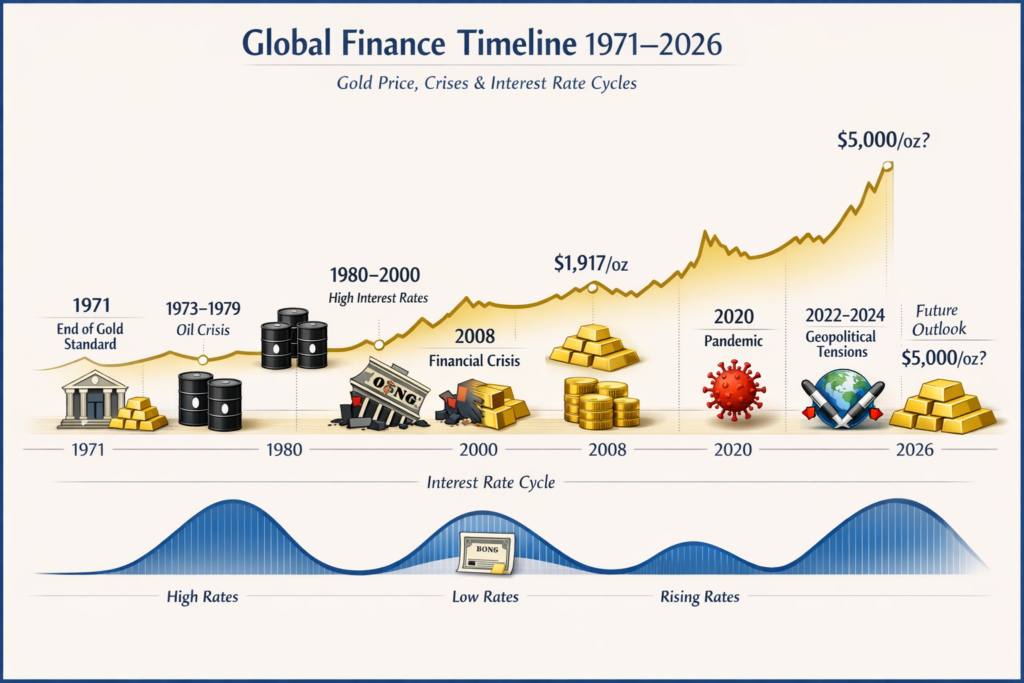
Image: Crises like COVID-19 often lead to market panic and monetary expansion, strengthening gold’s role as a hedge against inflation.
Regime D: 2012–2019 — Low Rates and Relative Stability
After 2012, gold prices corrected, while bonds continued delivering steady total returns.
Real yields remained low or negative, which supported both assets.
However, the period was relatively calm, with no dramatic performance gap between gold and bonds.
Regime E: 2020–2026 — Pandemic, Supply-Chain Shocks and Geopolitical Fragmentation
The pandemic pushed 10-year yields to historic lows near 0.5% in 2020.
- Then came a dramatic reversal:
- 2022–2023 saw a surge in yields
- bond indices experienced historic declines
Meanwhile gold continued setting new records.
By 2026, gold had exceeded $3,000 per ounce, and in some markets prices briefly approached $3,500 per ounce.
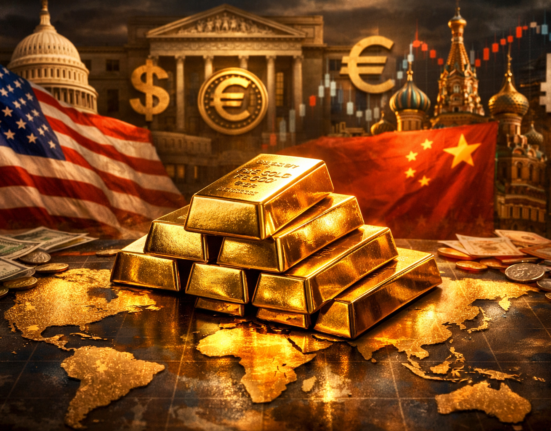
- The drivers of this cycle were unique:
- strong central-bank demand for gold
- geopolitical risk premiums
- growing uncertainty around the global monetary system
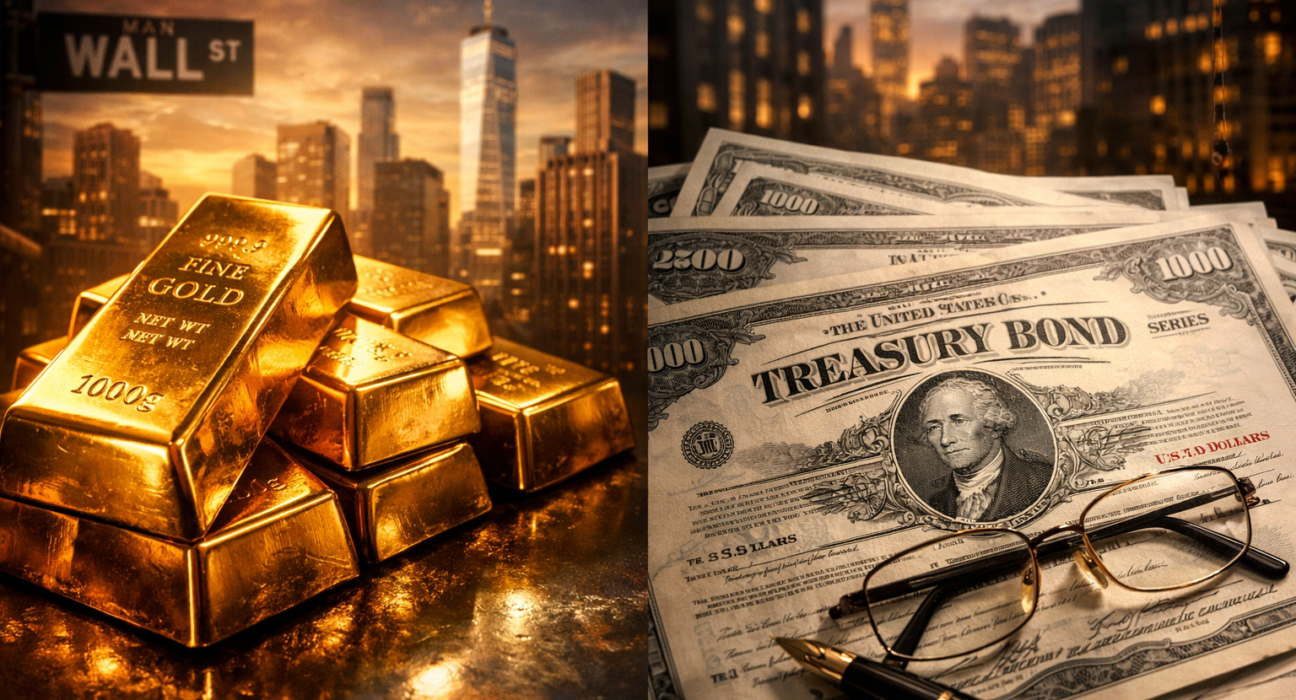
Image: Unlike paper money, physical gold provides tangible security and serves as a trusted hedge against inflation and economic uncertainty.
Do Falling Real Interest Rates Still Drive Gold?
Traditionally, gold is negatively correlated with real interest rates (TIPS yields).
When real yields decline, gold becomes more attractive because it does not pay interest.
However, recent years have challenged this rule.
Despite real yields exceeding 2%, gold continued rising.
The reason:
central-bank purchases and geopolitical uncertainty created demand beyond traditional macro models.
Bottom line: real interest rates still matter — but they are no longer the only driver of gold prices.
What Long-Term Data Shows
- Several long-term datasets illustrate this relationship:
- The World Gold Council Goldhub database shows that gold has delivered solid nominal returns since 1971, though with high volatility.
- Aswath Damodaran’s historical bond dataset highlights how bond returns benefited enormously from falling yields after 1981.
- The 2022 bond crash significantly changed the perception of bonds as the ultimate safe asset.
This shift has renewed interest in gold as a portfolio diversifier.
Three Saver Stories: Experiencing Different Cycles
The Late-1970s Saver (1977–1985)
A saver who bought 10-year Treasuries in 1977 watched inflation erode the real value of coupons while bond prices declined.
Meanwhile, a neighbor holding gold experienced explosive gains by 1980, followed by a sharp correction.
Lesson: gold performs extremely well during inflation shocks — but volatility is high.
The Volcker Era Saver (1982–2000)
A young couple buying bonds in the mid-1980s experienced one of the greatest bond decades ever.
High coupons combined with falling yields produced strong total returns.
Gold during this same period mostly stagnated.
PURCHASE OF GOLD. Free information. You can get up to 1/3 more precious metals!
- How can you buy gold and silver for investment?
- Much cheaper.
- We discover how you can reduce seller commissions.
- Highest quality. 999/1000. Good delivery.
Information worth its weight in gold. Completely free
It is not worth buying a single gram until you have this information.
Enter your name and email address now to participate for free.

The Post-2008 Investor
- An entrepreneur who bought gold after the 2008 financial crisis:
- enjoyed strong gains by 2011
- faced disappointment around 2013
- then saw prices surge again between 2020 and 2026
Bonds, meanwhile, thrived until 2020 but experienced a historic collapse in 2022.
Why Bonds Sometimes Beat Gold (And Vice Versa)
- Bonds outperform when:
- interest rates are high or falling
- inflation is stable
- coupon income is significant
Example: 1981–2000
- Gold outperforms when:
- real interest rates are low or negative
- inflation is high
- systemic risks increase
- central banks accumulate gold
Examples: 1970s, 2001–2011, 2024–2026
Key Turning Points
- Several moments reshaped the relationship between gold and bonds:
- 1981: 10-year yields peak near 15%
- 2008–2011: gold becomes the global crisis hedge
- 2020: yields fall to historic lows near 0.5%
- 2022: worst year ever for U.S. Treasury bonds
- 2024–2026: gold rises despite positive real yields
Returns Aren’t Everything: Cash Flow vs Insurance
- A 10-year bond provides coupon income and a maturity date.
Gold, however, pays no interest but carries no counterparty risk.
In stable economic periods this may appear to be a disadvantage.
But during crises, it becomes a powerful form of financial insurance.
That is why analysts often describe gold as a portfolio shock absorber.
Correlation Is Changing
For decades gold showed low or negative correlation with stocks and real interest rates.
However, 2023–2026 has challenged that pattern.
Large-scale central-bank purchases have become a dominant factor in the gold market.
Models that explained gold well between 2010 and 2020 now capture only part of the picture.
What Would $10,000 Have Done?
Rather than focusing on small percentage differences, it helps to think in regimes.
- Buying 10-year Treasuries in 1982 and holding for a decade almost certainly beat gold.
- Buying gold in 2001 and holding until 2011 outperformed bonds.
- Buying bonds in summer 2020 with yields near 0.5% was painful during the 2022 bond crash.
During that period, gold acted as a stabilizer in diversified portfolios.
The Possible Bond Regime Shift
Many analysts now argue that gold is no longer driven primarily by inflation narratives.
- Instead, the metal increasingly reflects:
- fiscal concerns
- geopolitical fragmentation
- central-bank accumulation
If the traditional relationship fully returned, real yields above 2% would normally pressure gold prices.
For now, the data suggests a more complex market dynamic.
How Gold and Bonds Fit in a Portfolio
- Conservative investors
- bond ladder as the portfolio core
- 5–10% allocation to gold for crisis protection
- Long-term savers
- combination of TIPS (real yield) and gold (system hedge)
- Tactical investors
- gold influenced by geopolitics and central-bank demand
- bonds influenced by inflation expectations and fiscal policy
This article describes general concepts and does not constitute investment advice.
Why 2022 Was Not the End of Bonds
While 2022 was historically bad for bonds, higher yields often improve long-term return expectations.
- Analysts in 2024–2026 increasingly discussed the “return of bonds”, though with several risks:
- U.S. fiscal uncertainty
- declining foreign demand for Treasuries
- persistent inflation shocks
This likely means more volatility in the coming years.
The Key Takeaway
- Looking at the past half-century:
- 1970s: gold > bonds
- 1981–2000: bonds > gold
- 2001–2011: gold > bonds
- 2012–2019: both performed well
- 2020–2026: bonds suffered in 2022 while gold reached new highs
The most resilient portfolios therefore do not choose one over the other.
Instead they combine both:
bonds for income and stability — gold for protection against systemic risk.
 May Fortuna be with you
FAQ
Gold peaked around $850 per ounce in January 1980 during high inflation, geopolitical tensions and declining confidence in fiat currencies.
Because yields started extremely high (around 15%) and then declined for decades, generating both coupon income and capital gains.
Yes. For the Bloomberg U.S. Treasury Index, 2022 was the worst year since modern index tracking began.
Often — but not always. Between 2023 and 2026, gold continued rising even with positive real yields due to strong central-bank demand and geopolitical uncertainty.
The World Gold Council Goldhub database provides interactive charts of historical gold returns.
On FRED (Federal Reserve Economic Data) using the DGS10 and DFII10 datasets.